Home Air Quality Monitoring System: Complete Setup Guide
A home air quality monitoring system tracks invisible pollutants in your indoor air, particulate matter (PM2.5), volatile organic compounds (VOCs), carbon dioxide (CO2), humidity, and temperature, giving you the data you need to protect your respiratory health and sleep quality. Setting up these systems involves choosing the right device for your space, connecting it to your WiFi network, placing monitors in optimal locations (3-6 feet high, away from windows), and configuring alert thresholds that notify you when pollutant levels spike.
Table of Contents
- Understanding What Home Air Quality Monitors Measure and Why It Matters
- The Five Essential Measurements Every System Should Track
- How Poor Air Quality Affects Health After 55
- Choosing the Right Monitoring System for Your Home Size and Budget
- Single Monitor vs. Multi-Room System: Making the Right Choice
- Key Features Worth Paying For (and What You Can Skip)
- Pre-Setup: Preparing Your Home and WiFi Network
- Checking WiFi Coverage and Strengthening Weak Signals
- Identifying the Best Placement Locations in Each Room
- Step-by-Step Installation and Initial Configuration
- Physical Setup and Power Connection
- Connecting Your Monitor to WiFi and Mobile App
- Setting Up Alerts and Notification Preferences
- Initial Calibration and Baseline Reading Period
- Deploying Multiple Monitors and Room Prioritization Strategy
- Which Rooms to Monitor First (and Why)
- Organizing and Naming Your Devices for Easy Monitoring
- Ongoing Maintenance, Data Interpretation, and Taking Action
- Weekly and Monthly Maintenance Tasks
- Understanding Your Readings and When to Take Action
Understanding What Home Air Quality Monitors Measure and Why It Matters
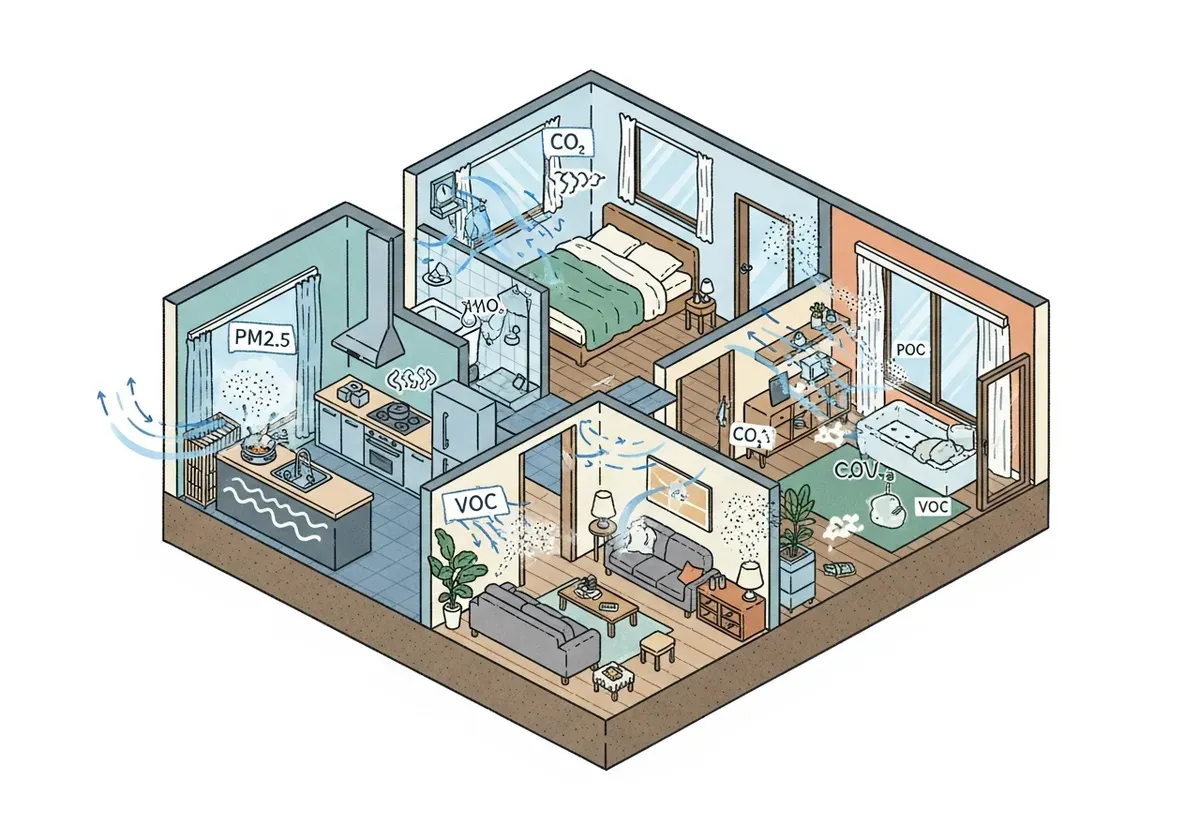
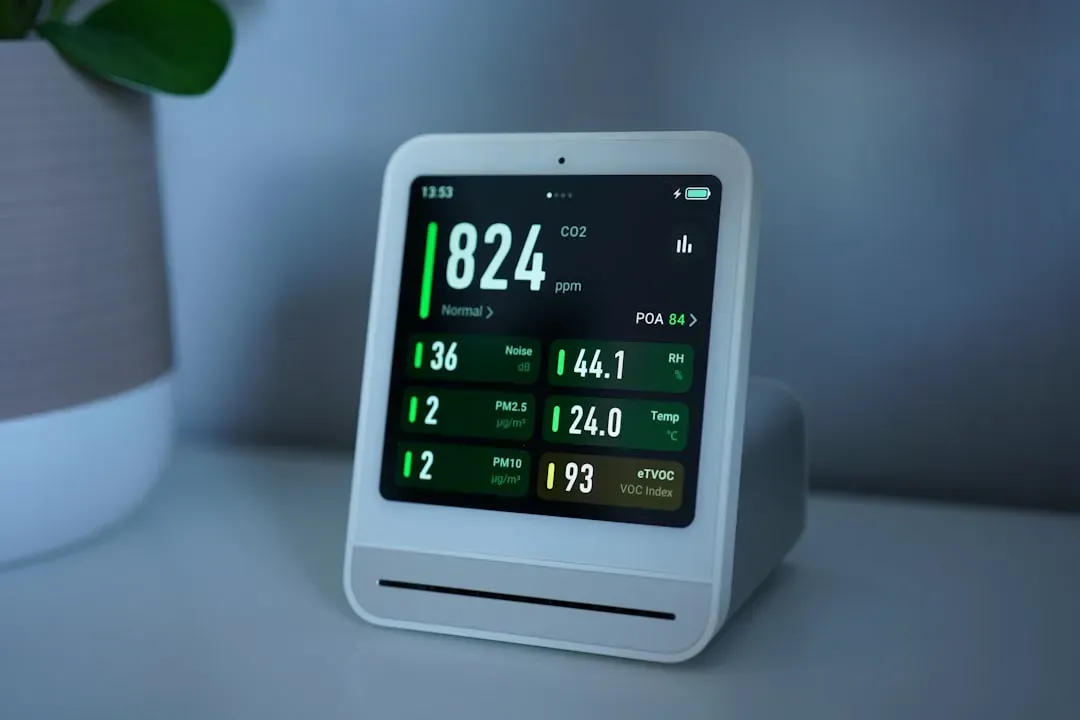
Indoor air quality monitors function as diagnostic tools that measure pollutants you can't see or smell until they've already affected your health. These devices track five core measurements, each connected to specific sources in your home and distinct health impacts.
The Five Essential Measurements Every System Should Track
PM2.5 refers to particulate matter smaller than 2.5 micrometers, about 1/30th the width of a human hair. These microscopic particles come from cooking smoke, candle burning, and outdoor pollution that seeps indoors. Because of their tiny size, PM2.5 particles lodge deep in your lungs and can even enter your bloodstream (according to the EPA). Good readings stay below 12 μg/m³, while levels above 35 μg/m³ indicate poor air quality that triggers respiratory irritation.
VOCs (volatile organic compounds) are gases released from cleaning products, air fresheners, new furniture, and paint. Your monitor detects these chemicals as they off-gas into your breathing space. Indoor VOC concentrations run up to ten times higher than outdoor levels (according to the EPA), which explains why that "new car smell" or fresh paint odor can trigger headaches. Monitors typically display VOC levels on a scale from 0-500 ppb (parts per billion), with readings below 220 ppb considered acceptable.
CO2 (carbon dioxide) accumulates in poorly ventilated spaces where people are breathing. When your monitor shows CO2 climbing above 1000 ppm (parts per million), you're experiencing stuffiness that impairs concentration and sleep quality. Opening a window or running ventilation typically drops levels back to the outdoor baseline of 400 ppm.
Humidity affects both comfort and mold growth potential. Monitors track relative humidity as a percentage, with the ideal range between 30-50%. Levels above 60% create conditions where mold spores thrive, while readings below 30% dry out mucous membranes and worsen respiratory irritation.
Temperature monitoring seems basic but matters for interpreting other readings, warmer air holds more moisture and can increase VOC off-gassing rates from materials in your home.
How Poor Air Quality Affects Health After 55
Older adults face heightened vulnerability to air pollutants because lung capacity naturally declines with age and existing health conditions amplify exposure risks. PM2.5 particles trigger inflammation in airways that's particularly problematic if you're managing asthma, COPD, or cardiovascular disease (according to the EPA).
Sleep quality deteriorates when bedroom air contains elevated CO2 or PM2.5 levels. Research shows that poor nighttime air quality fragments sleep cycles and reduces time spent in restorative deep sleep phases. Well, this explains why you might wake feeling unrested despite spending eight hours in bed.
Cognitive function responds to indoor air quality more than most people realize. Studies on office workers found that elevated CO2 concentrations (above 1000 ppm) measurably reduced decision-making performance and strategic thinking. For older adults concerned about maintaining mental sharpness, monitoring and controlling CO2 becomes a practical intervention rather than abstract health advice.
VOC exposure from common household products causes symptoms that often get misattributed to other causes, persistent headaches, fatigue, and difficulty concentrating. Americans spend approximately 90% of their time indoors where pollutant concentrations often run 2-5 times higher than outdoor air (according to the National Institute of Environmental Health Sciences).
Choosing the Right Monitoring System for Your Home Size and Budget
Selecting an air quality monitor requires matching device capabilities to your home's square footage, your technical comfort level, and how much you're willing to invest in ongoing air quality management.
Air Quality Measurements: Standards, Sources, and Health Impact
| Pollutant | Measurement Unit | Acceptable Level | Poor/Alert Level | Common Sources |
|---|---|---|---|---|
| PM2.5 (Particulate Matter) | μg/m³ | Below 12 | Above 35 | Cooking smoke, candles, outdoor pollution |
| VOCs (Volatile Organic Compounds) | ppb | Below 220 | Above 220 | Cleaning products, air fresheners, new furniture, paint |
| CO2 (Carbon Dioxide) | ppm | 400 (outdoor baseline) | Above 1000 | Poor ventilation, human respiration |
| Humidity (Relative) | % | 30-50% | Above 60% or below 30% | Moisture sources, ventilation levels |
| Temperature | °F/°C | Varies by preference | Affects other readings | HVAC systems, external environment |
Single Monitor vs. Multi-Room System: Making the Right Choice
A single monitor works well for apartments under 800 square feet or as a starter device to identify problem areas before expanding coverage. Place your first monitor in the room where you spend the most time, typically the bedroom or main living area. This approach costs $100-250 upfront and lets you learn how air quality fluctuates in your space without overwhelming yourself with data from multiple locations.
Multi-room systems make sense for homes above 1200 square feet where air quality varies significantly between spaces. Kitchens generate cooking pollutants that don't reach bedrooms, while basements may harbor humidity issues invisible to monitors placed upstairs. Installing 2-3 monitors costs $300-600 initially but reveals patterns a single device misses, like discovering your bedroom CO2 spikes overnight while living room air stays fresh.
Honestly, most people benefit from starting with one monitor and adding devices after identifying which rooms need attention. This staged approach prevents analysis paralysis and keeps initial costs manageable while you're learning to interpret readings and take corrective actions.
Key Features Worth Paying For (and What You Can Skip)
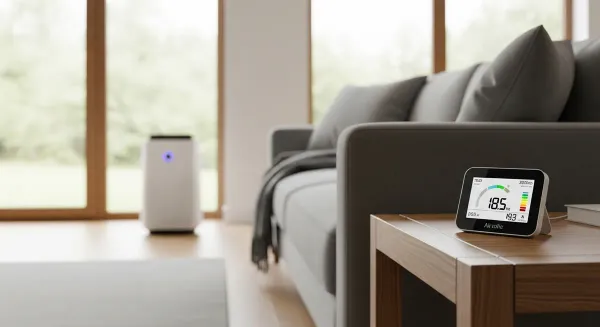
A clear, backlit display that you can read from across the room qualifies as essential, checking air quality shouldn't require walking over to squint at tiny numbers. Alert notifications via smartphone app matter if you want warnings when pollutant levels spike while you're cooking or cleaning. These two features justify spending $120-200 on a quality monitor rather than buying a $50 device with a dim screen and no connectivity.
Smart home integration (connecting to Alexa, Google Home, or HomeKit) adds convenience but not core functionality. You can skip this feature unless you already have automated ventilation or air purifiers that respond to air quality triggers. Historical data tracking and trend graphs help you identify patterns over weeks and months, making this feature valuable for anyone serious about improving their indoor environment.
Battery operation versus plug-in power represents a trade-off between placement flexibility and maintenance. Battery-powered monitors go anywhere but require recharging every 1-3 months. Plug-in models eliminate battery anxiety but limit placement to areas near outlets. For bedrooms, plug-in makes sense since outlets exist near beds, for living rooms, battery operation provides more flexibility.
Pre-Setup: Preparing Your Home and WiFi Network
Successful monitor installation starts before you open the box. Checking your WiFi coverage and identifying optimal placement locations prevents frustrating troubleshooting after you've already mounted devices or downloaded apps.
Single Monitor vs. Multi-Room System Comparison
| Factor | Single Monitor System | Multi-Room System |
|---|---|---|
| Best For | Small apartments, single rooms, budget-conscious buyers | Larger homes, multiple bedrooms, comprehensive monitoring |
| Initial Cost | Lower ($100-300) | Higher ($400-1000+) |
| Coverage | One location only | 3-6+ locations simultaneously |
| Setup Complexity | Simple, minimal WiFi requirements | More complex, requires strong WiFi mesh |
| Data Insights | Limited to one room's conditions | Identifies problem areas across entire home |
| Scalability | Can add monitors later | Usually designed as complete system |
| Maintenance Burden | Minimal (one device) | Higher (multiple devices to maintain) |
Checking WiFi Coverage and Strengthening Weak Signals
Most air quality monitors require a 2.4 GHz WiFi connection to transmit data to your smartphone. Walk through your home with your phone's WiFi settings open, if you see your network name with 2-3 bars or less in a room where you plan to place a monitor, that location may cause connectivity problems.
To be fair, solving weak WiFi often requires just repositioning your router to a more central location rather than buying new equipment. Routers tucked in closets or placed on the floor broadcast signals that furniture and walls block. Moving your router to an open shelf at waist height can double effective range.
If repositioning doesn't work, a WiFi extender ($25-60) plugs into an outlet halfway between your router and the problem area, rebroadcasting the signal. Look for extenders that maintain your existing network name rather than creating a separate network, this simplifies device connections.
Identifying the Best Placement Locations in Each Room
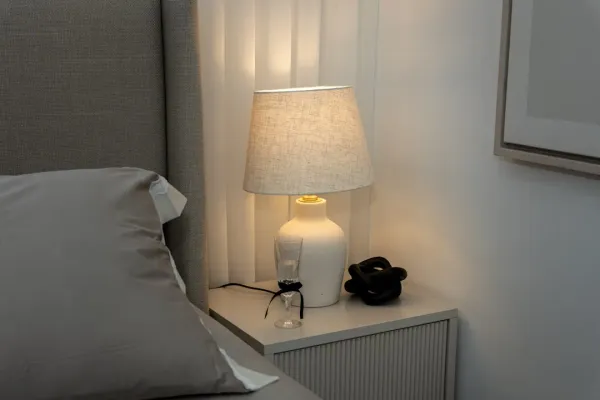
Air quality monitors measure most accurately when placed in your breathing zone, the EPA defines this as 3-6 feet above the floor, which corresponds to where your nose sits when standing, sitting, or lying in bed. A bedroom monitor belongs on a nightstand or dresser rather than mounted near the ceiling where it samples air you're not breathing.
Avoid placing monitors within three feet of windows, exterior doors, or HVAC vents. These locations experience air quality that doesn't represent the room as a whole, vents blast filtered air directly past sensors, while windows introduce outdoor air that skews readings. Corner placement works better than spots in direct airflow paths.
Keep monitors away from direct sunlight, which heats the device and throws off temperature and humidity readings. Kitchens require special consideration, place monitors at least eight feet from stoves to avoid overwhelming sensors with cooking emissions that don't represent air quality in adjacent rooms.
Step-by-Step Installation and Initial Configuration
Setting up your monitoring system follows a specific sequence that prevents common connection failures and ensures accurate baseline readings from day one.
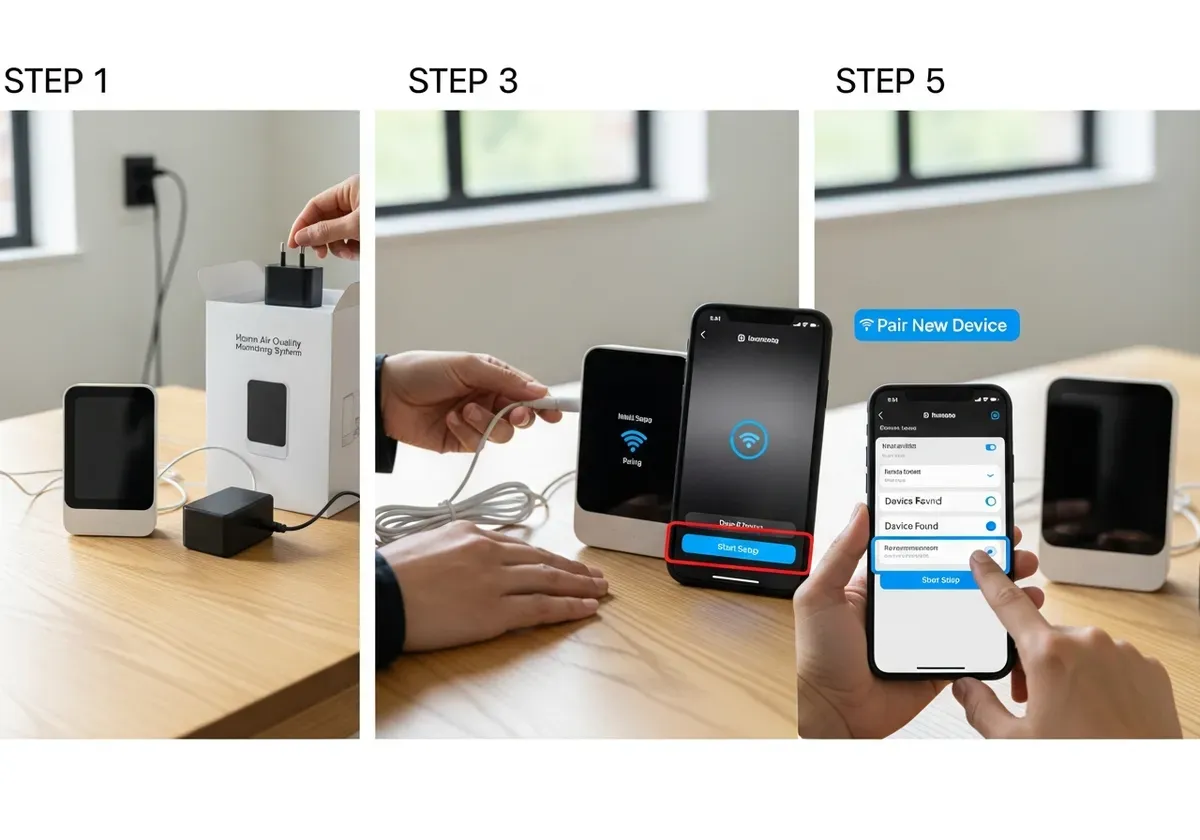
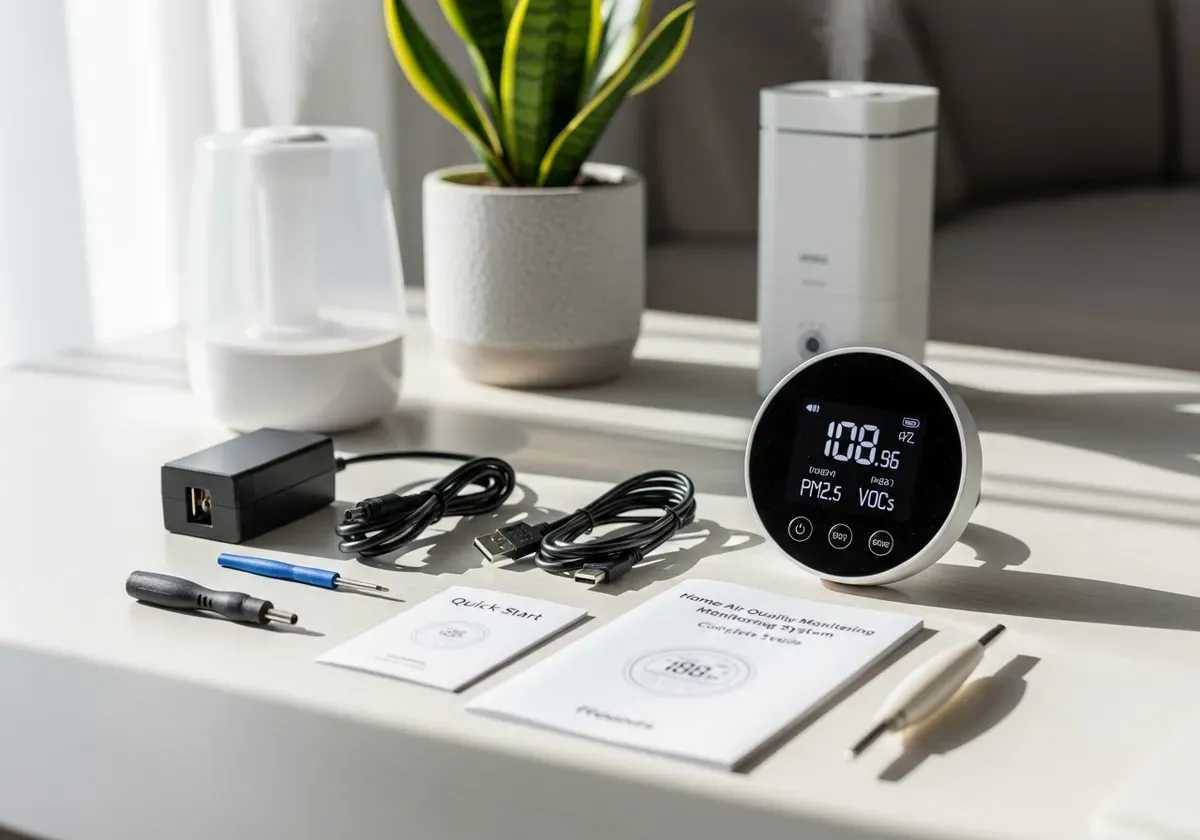
Physical Setup and Power Connection
Unbox your monitor and locate the quick start guide, power adapter (if included), and any mounting hardware. Most monitors include a USB cable and wall adapter, though some premium models use proprietary charging cables, keep these in a designated spot since replacements can be hard to find.
For plug-in operation, connect the power cable and place the monitor in your chosen location before powering on. Battery-powered units need a full initial charge (2-4 hours) before first use, check the manual since some models ship partially charged while others arrive completely drained.
If you're mounting the device on a wall, use the included template to mark screw holes. Standard drywall anchors work for most monitors under one pound.
Connecting Your Monitor to WiFi and Mobile App
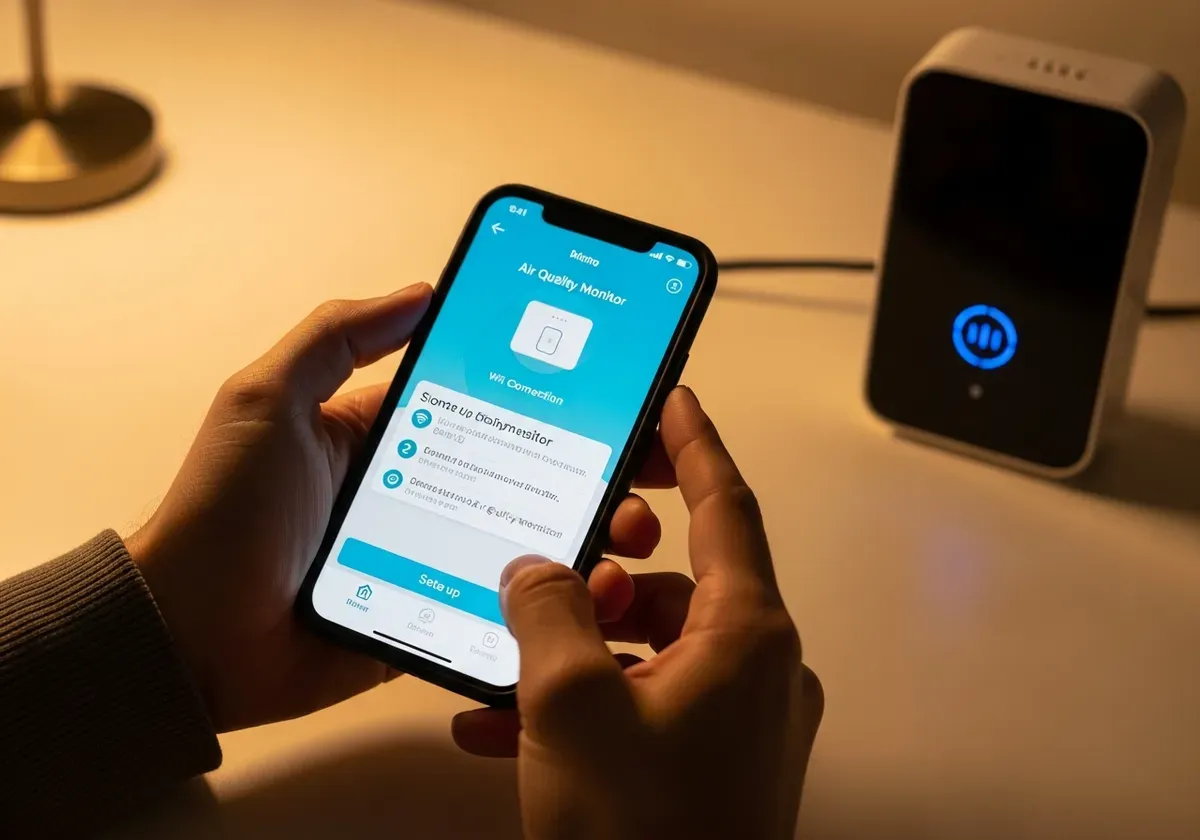
Download the manufacturer's app before powering on your monitor, search your phone's app store using the brand name printed on the device. Create an account using an email address you check regularly, since this is where alert notifications will arrive.
Power on your monitor and wait for it to enter pairing mode, usually indicated by a blinking WiFi icon or LED. Open the app and select "Add Device" or "Setup New Monitor." The app will search for your monitor and prompt you to select your WiFi network from a list.
Here's the thing, most connection failures happen because monitors only work with 2.4 GHz networks, not the 5 GHz band that many modern routers broadcast simultaneously. If your network name appears twice in the list (like "HomeNetwork" and "HomeNetwork-5G"), choose the version without "5G" in the name. Enter your WiFi password carefully, connection attempts fail if you mistype even one character.
The monitor will display "Connecting" for 30-90 seconds before confirming success. If connection fails after two attempts, move the monitor closer to your router for initial setup, you can relocate it afterward once the connection is established.
Setting Up Alerts and Notification Preferences
Navigate to the app's settings menu and locate notification preferences. Start by enabling alerts for PM2.5 above 35 μg/m³ and VOCs above 300 ppb, these thresholds indicate air quality that warrants opening windows or running an air purifier.
CO2 alerts make sense at 1000 ppm, the point where stuffiness becomes noticeable and cognitive performance starts declining. Humidity alerts at 60% help you catch moisture problems before mold establishes.
Configure quiet hours if you don't want notification sounds waking you overnight. Most apps let you set a schedule (like 10 PM to 7 AM) where alerts still appear on your phone but don't make noise or vibrate.
Initial Calibration and Baseline Reading Period
Your monitor needs 24-48 hours to establish accurate baseline readings. Sensors require time to stabilize after shipping and acclimate to your home's specific conditions. Don't panic if readings seem erratic during the first day, this is normal sensor behavior, not a defective unit.
Avoid making air quality judgments or taking corrective actions during this calibration period. Let the monitor run undisturbed while you go about normal activities. After two days, the readings will reflect your home's actual air quality patterns rather than post-shipping sensor drift.
Deploying Multiple Monitors and Room Prioritization Strategy
If you're installing more than one monitor, strategic placement and thoughtful device organization prevent data overload while maximizing useful insights about your indoor environment.
Which Rooms to Monitor First (and Why)
Your bedroom deserves the first monitor because you spend 6-9 hours there nightly in a vulnerable state where air quality directly impacts sleep quality and morning respiratory symptoms. Elevated CO2 from poor overnight ventilation or PM2.5 from outdoor pollution seeping through windows affects how rested you feel each morning.
Main living areas warrant the second monitor since you spend waking hours there exposed to VOCs from furniture, cleaning products, and activities like candle burning. Living room air quality tends to be more variable than bedrooms, spiking during cooking or when guests visit, then returning to baseline during quiet periods.
Kitchens generate the highest pollutant spikes from cooking, gas stoves release nitrogen dioxide while high-heat cooking creates PM2.5 from aerosolized oils. A kitchen monitor helps you identify when you need to run the range hood or open windows, but this should be your third device since kitchen air quality problems rarely extend to other rooms if you ventilate properly.
Organizing and Naming Your Devices for Easy Monitoring
Rename your monitors immediately after pairing them using clear location labels like "Master Bedroom," "Living Room," or "Kitchen" rather than accepting default names like "Device 1" or the device serial number. You'll thank yourself later when checking readings at a glance or responding to alerts.
Most apps let you set a "home" screen showing all monitors simultaneously. Arrange devices in order of importance, bedroom first, living areas second, supplementary rooms last. This layout lets you scan air quality across your home in five seconds without hunting through menus.
Ongoing Maintenance, Data Interpretation, and Taking Action
Air quality monitors require minimal maintenance but benefit from regular attention to ensure accurate readings and meaningful insights that improve your indoor environment.
Weekly and Monthly Maintenance Tasks
Dust accumulation on sensor inlets affects accuracy over time. Wipe your monitor's exterior weekly with a dry microfiber cloth, paying attention to any ventilation holes or mesh screens where sensors sample air. Never use cleaning sprays directly on the device, VOCs from cleaners will contaminate sensors and cause falsely elevated readings for hours.
Check battery levels monthly if you're using wireless monitors. Most apps display battery status, but physically checking the device prevents surprise shutdowns. Replace or recharge batteries before they drop below 20% to maintain consistent monitoring.
Review your app's historical data monthly to identify patterns. Look for recurring spikes at specific times (cooking hours, when you run the dryer) or gradual trends (rising baseline humidity in winter). These patterns reveal opportunities for targeted improvements rather than vague concerns about "air quality."
Understanding Your Readings and When to Take Action
PM2.5 readings above 35 μg/m³ warrant immediate ventilation, open windows if outdoor air quality is good, or run an air purifier if you're dealing with wildfire smoke or high outdoor pollution. Sustained bedroom levels above 12 μg/m³ suggest you need better filtration or to identify indoor particle sources like candles or dusty HVAC ducts.
VOC spikes during cleaning or after bringing new furniture home are normal and temporary. Ventilate aggressively for 2-3 hours and readings should drop. Persistent elevated VOCs (above 300 ppb for days) indicate ongoing off-gassing that requires either removing the source or dramatically increasing ventilation until the material finishes releasing chemicals.
CO2 above 1000 ppm signals inadequate ventilation for the number of people in the space. Opening a window for 15 minutes typically drops levels by 200-300 ppm. If bedroom CO2 climbs overnight despite ventilation, consider a small fan to promote air circulation without creating uncomfortable drafts.
Humidity above 60% for extended periods creates mold risk. Run a dehumidifier or increase ventilation to bring levels back to 40-50%. Below 30% humidity dries out respiratory passages, add a humidifier or place water-filled bowls near heat sources to raise moisture levels naturally.
I learned this the hard way when my monitor showed bedroom CO2 hitting 1,400 ppm every morning—I'd wake up groggy with a dull headache I'd always blamed on poor sleep. Cracking the window just three inches before bed dropped those levels to 800 ppm, and within two days the morning fog lifted completely. The difference between 'I slept eight hours' and 'I slept eight hours with actual oxygen' turned out to be measurable at 600 ppm.
Your monitoring system works best when you treat data as actionable intelligence rather than abstract numbers. Check readings daily for the first month to learn your home's patterns, then shift to weekly reviews unless alerts notify you of problems. The goal isn't perfect air quality every moment, it's identifying and correcting the specific issues affecting your health and comfort.
Related Articles
- Best Indoor Air Quality Monitors: 2024 Buyer's Guide & Reviews
- Indoor Air Quality Testing: Complete Guide to Testing Your Home
- How to Test Air Quality in Your Home: DIY & Professional Methods
- 9 Science-Backed Air Purifier Benefits for Your Health & Home
- Where to Place Your Air Purifier: Room-by-Room Placement Guide
- Ideal Humidity Levels for Home: Complete Comfort Guide
Frequently Asked Questions
How often do I need to calibrate my air quality monitor after initial setup?
Most monitors require calibration only during initial setup, but you should check manufacturer recommendations as some models need recalibration every 6-12 months. If readings seem inconsistent or your monitor has been exposed to extreme temperatures, recalibration may be necessary. Refer to your device's manual for specific calibration procedures.
Can I place my air quality monitor near a window or air vent?
No, you should avoid placing monitors near windows, doors, or air vents as these locations don't represent your actual breathing air quality. Position monitors 3-6 feet high on interior walls, away from direct airflow, to get accurate readings of the air you're actually inhaling throughout the day.
What should I do if my CO2 levels are consistently above 1000 ppm?
High CO2 indicates poor ventilation and can impair concentration and sleep quality. Open windows regularly, use exhaust fans in bathrooms and kitchens, or consider installing a mechanical ventilation system. Running an air purifier alone won't reduce CO2—you need actual fresh air exchange from outside.
Do I need to monitor every room in my home?
Start by monitoring high-priority rooms like bedrooms (for sleep quality), kitchens (cooking emissions), and home offices (CO2 buildup). Once you understand your home's air patterns, you can decide if additional rooms need monitoring or if one central monitor provides sufficient data.
What's the difference between acceptable VOC levels and poor air quality?
Readings below 220 ppb (parts per billion) are considered acceptable, while higher levels can trigger headaches and respiratory irritation. If your monitor shows elevated VOCs, identify the source (new furniture, cleaning products, paint) and increase ventilation or remove the offending item.
How can I improve air quality if humidity is above 60%?
Use a dehumidifier to bring levels below 60% and prevent mold growth, ensure bathrooms are well-ventilated during and after showers, and check for water leaks or condensation sources. In humid climates, running air conditioning naturally reduces humidity levels.
Will a single monitor work for a multi-story home?
A single monitor provides data for only one location and won't capture air quality variations across different floors or rooms. For accurate whole-home monitoring, consider a multi-room system or strategically place monitors on each level, prioritizing bedrooms and main living areas first.
What maintenance do air quality monitors require?
Most monitors need weekly visual checks for dust buildup and monthly sensor cleaning with a soft, dry cloth. Check your device manual for specific maintenance intervals, as some sensors may require professional cleaning or replacement annually to maintain accuracy.